Awesome Strategies to Visualize Change with Time
Professional plots with links to R code from Bo Yuan, PhD
Original Blog Post: Awesome Strategies to Visualize Change with Time
Authors: Bo Yuan, PhD
Published: 2024-05-07
My summary:
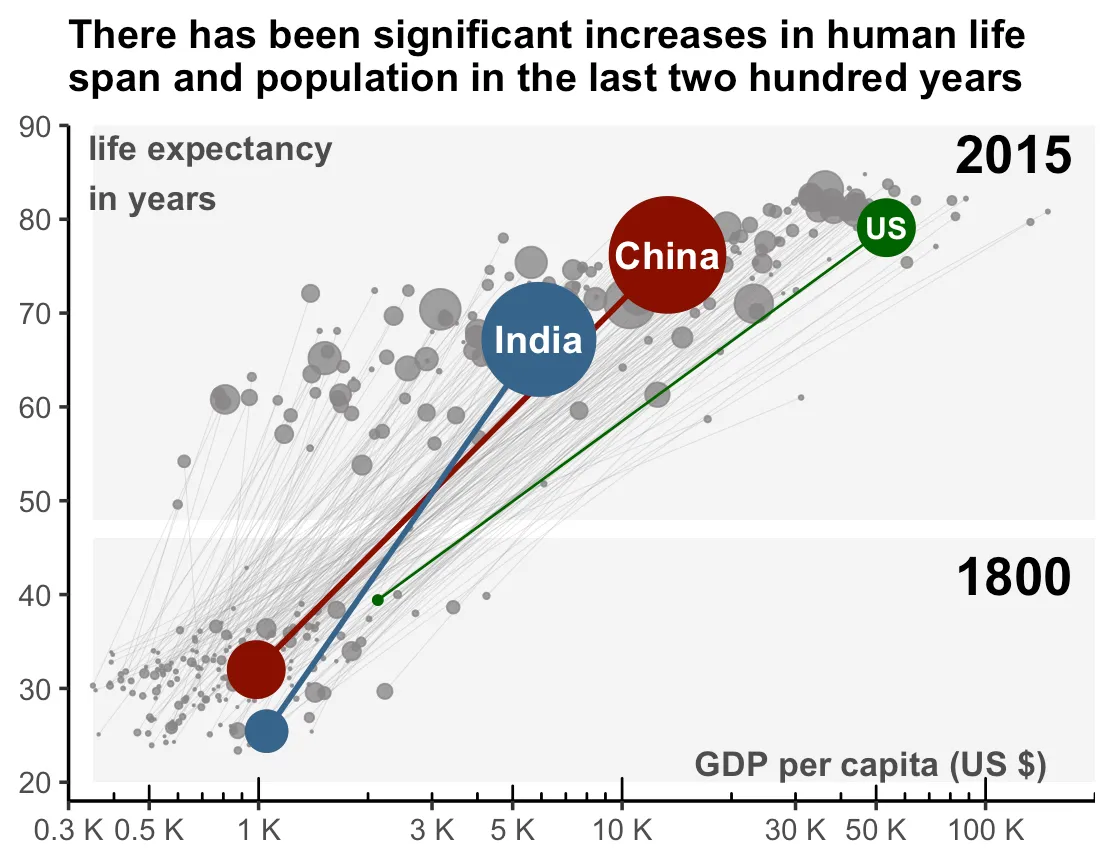
In this blog post, the author presents some professional-looking plots, created in R, some of them inspired by sources like the Wall Street Journal. The author includes links to the R code for each plot.
While this post is on Medium, the author also points to their website, DataBrewer.co, with even more code and examples.
Here is the link again to their blog post for more details: Awesome Strategies to Visualize Change with Time